NYC Aquatics Enrollment Prediction
A regression project that predicts NYC aquatics enrollment from borough, pool, and class type data.
Quick read
The project in a few seconds.
6,217 rows
Cleaned records used for modeling.
Linear regression
Enrollment prediction.
0.5967
Model evaluation score.
5.56
About six registrations off on average.
How it works
The project from input to outcome.
NYC Data
Raw program records
Clean
Prepare usable rows
Encode
Categorical features
Regression
Train model
Evaluate
Metrics + visuals
My contribution
The pieces I directly worked on.
Cleaned a real NYC Open Data dataset for aquatics programming.
Used borough, swimming pool, and class type as predictors for total registration.
Applied one-hot encoding to convert categorical variables into model-ready features.
Trained a multiple linear regression model to predict enrollment.
Evaluated the model using R², MAE, and RMSE.
Created visualizations comparing actual vs. predicted enrollment.
Engineering proof
A few decisions that show what was happening under the surface.
Decision 01
Used regression because the target variable, Total Registration, is numerical.
Decision 02
Kept the first version focused on interpretable features instead of adding unnecessary complexity.
Decision 03
Used one-hot encoding because the main predictors were categorical variables.
Results
The proof that the build came together.
Cleaned the dataset down to 6,217 usable rows.
Built a multiple linear regression model with an R² score of 0.5967.
Achieved a Mean Absolute Error of 5.56, meaning predictions were off by about 6 registrations on average.
Achieved a Root Mean Squared Error of 7.21, showing the typical size of larger prediction errors.
Product
See the work instead of only reading about it.
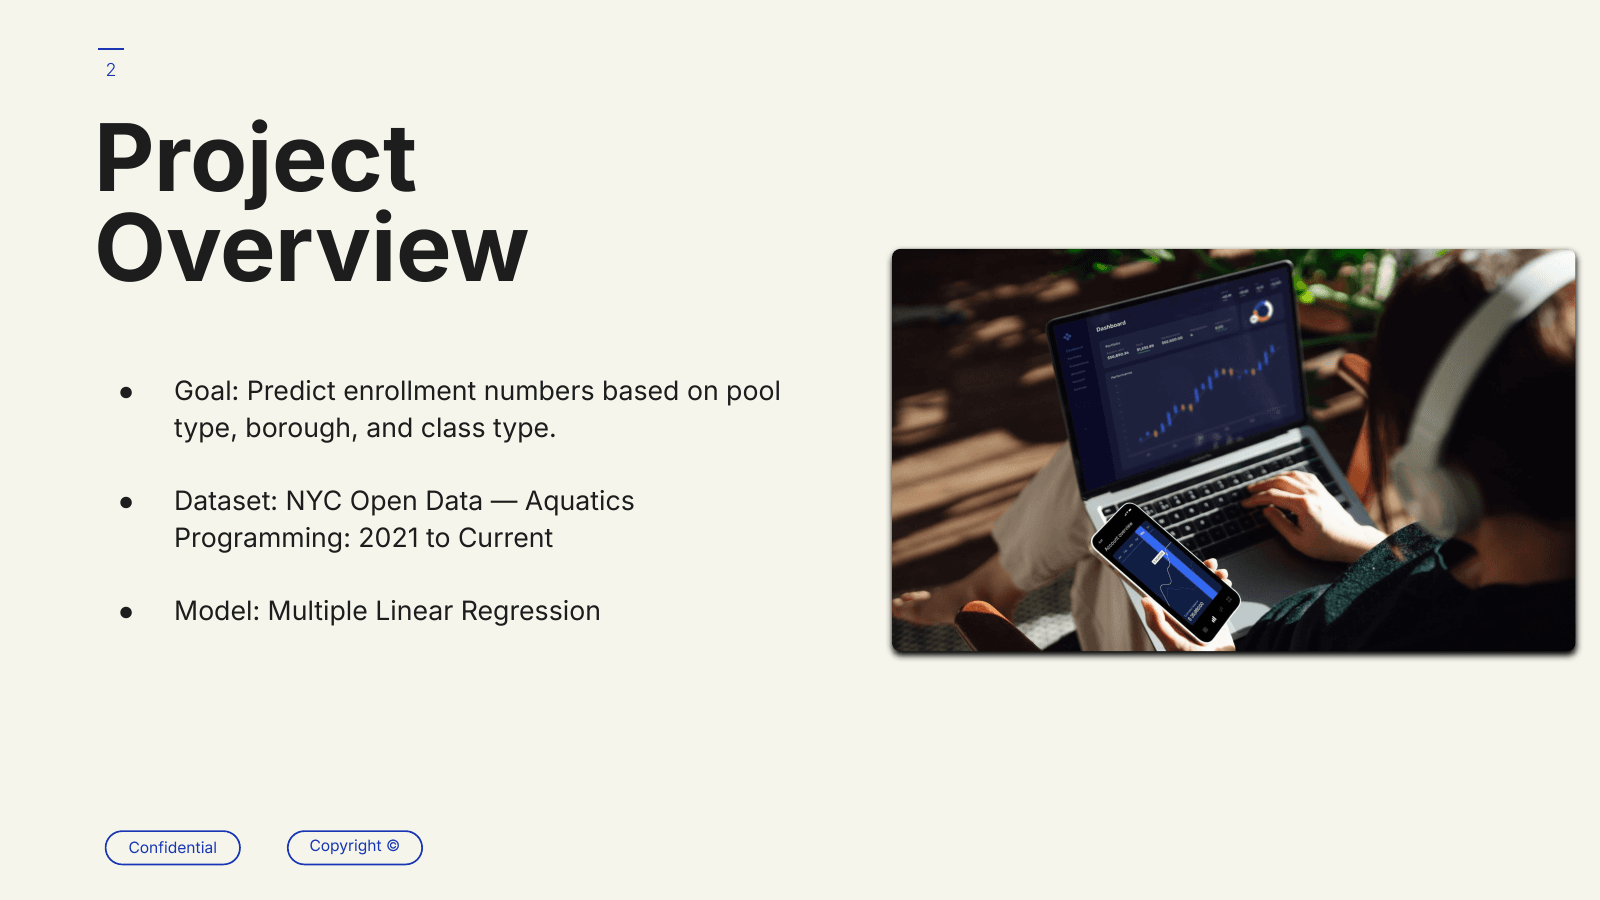
Project overview showing the goal of predicting enrollment using pool type, borough, and class type.
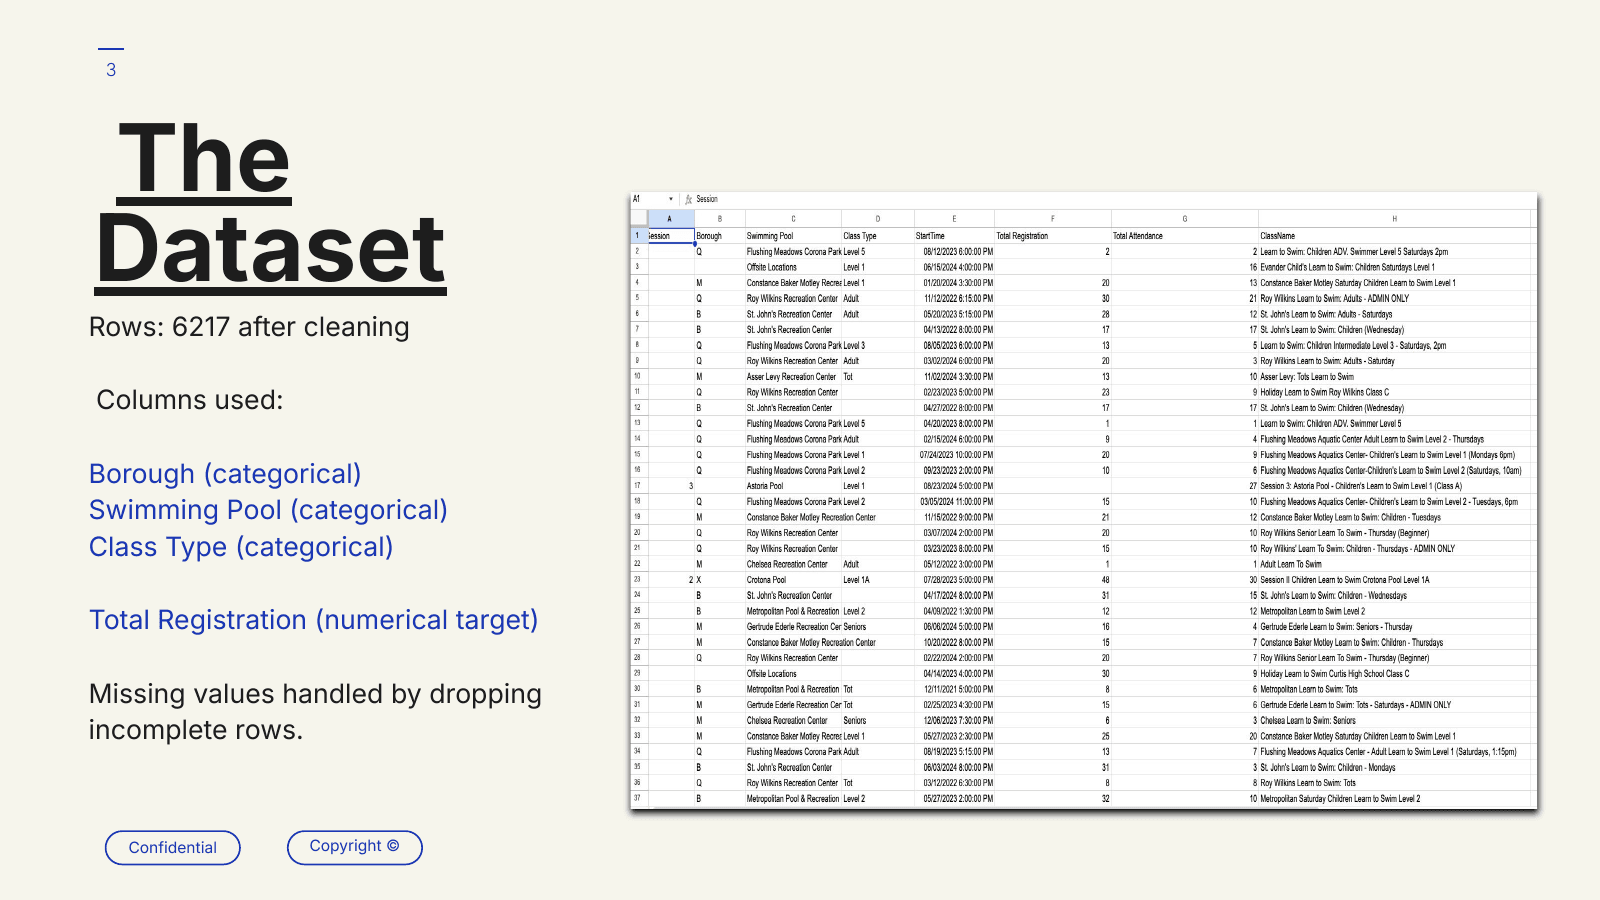
Dataset summary showing cleaned rows, selected categorical features, and the numerical target variable.
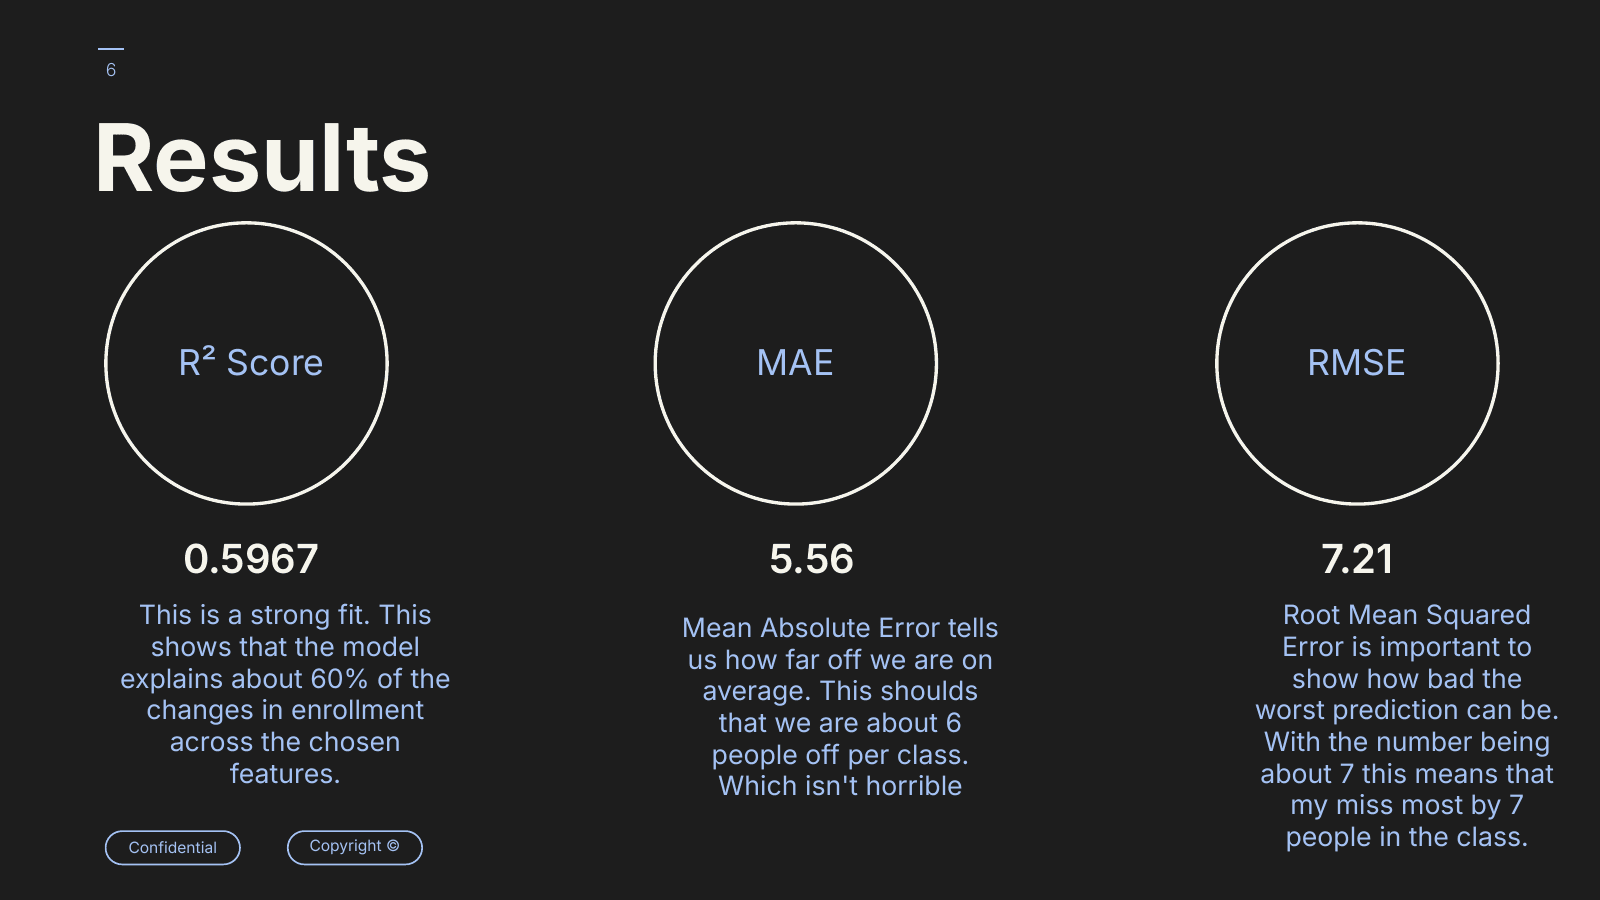
Regression results showing R², Mean Absolute Error, and Root Mean Squared Error.
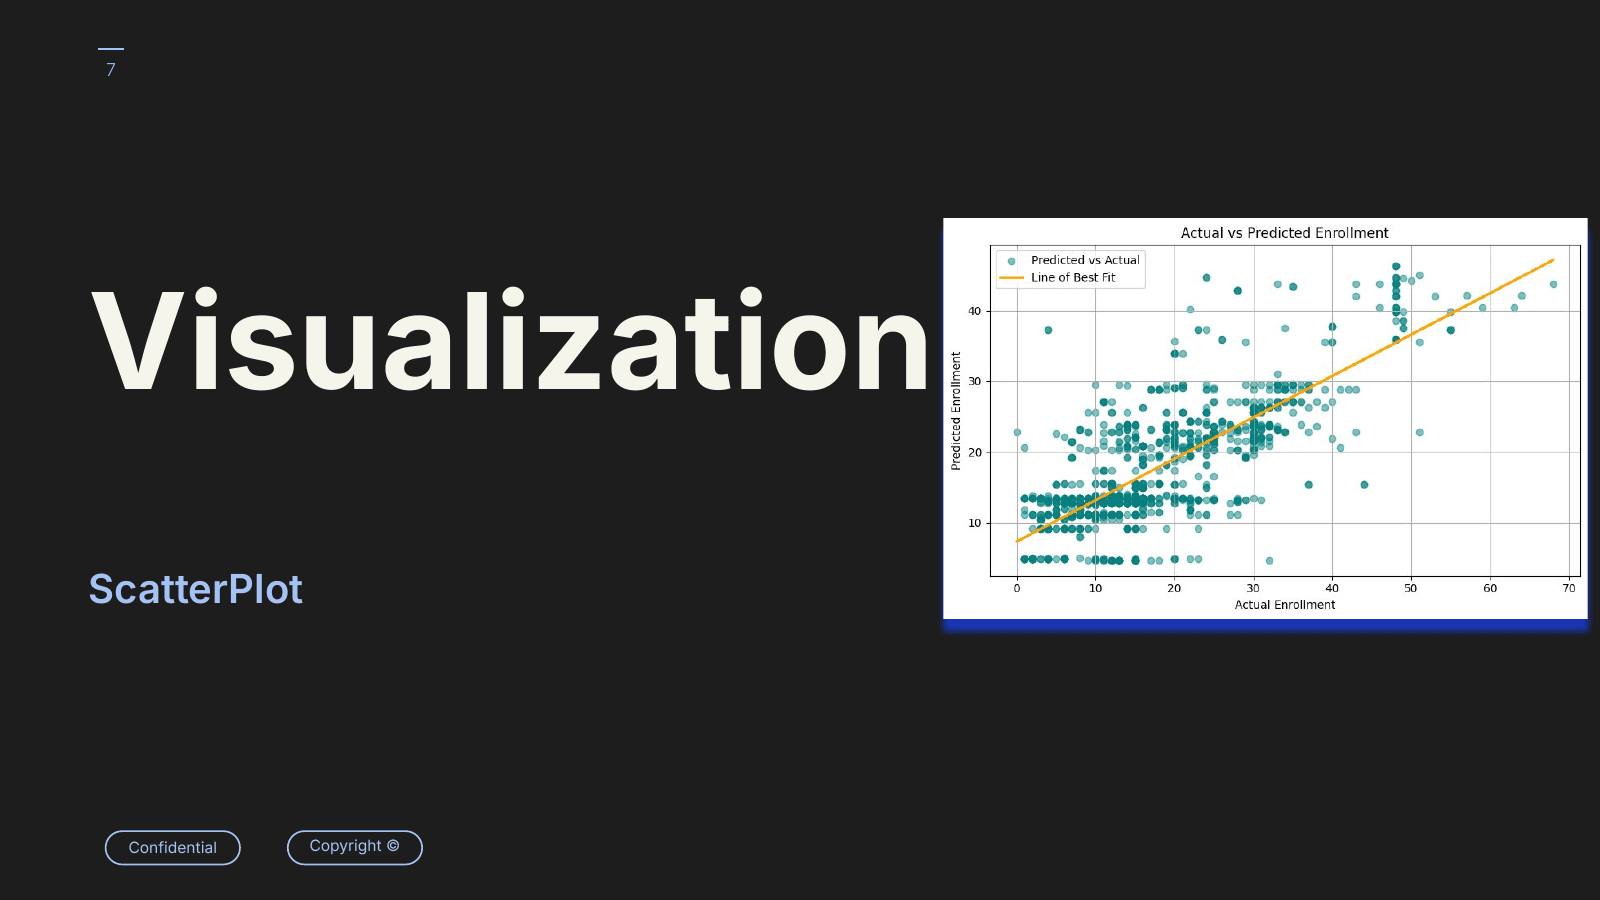
Visualization comparing actual enrollment against predicted enrollment.
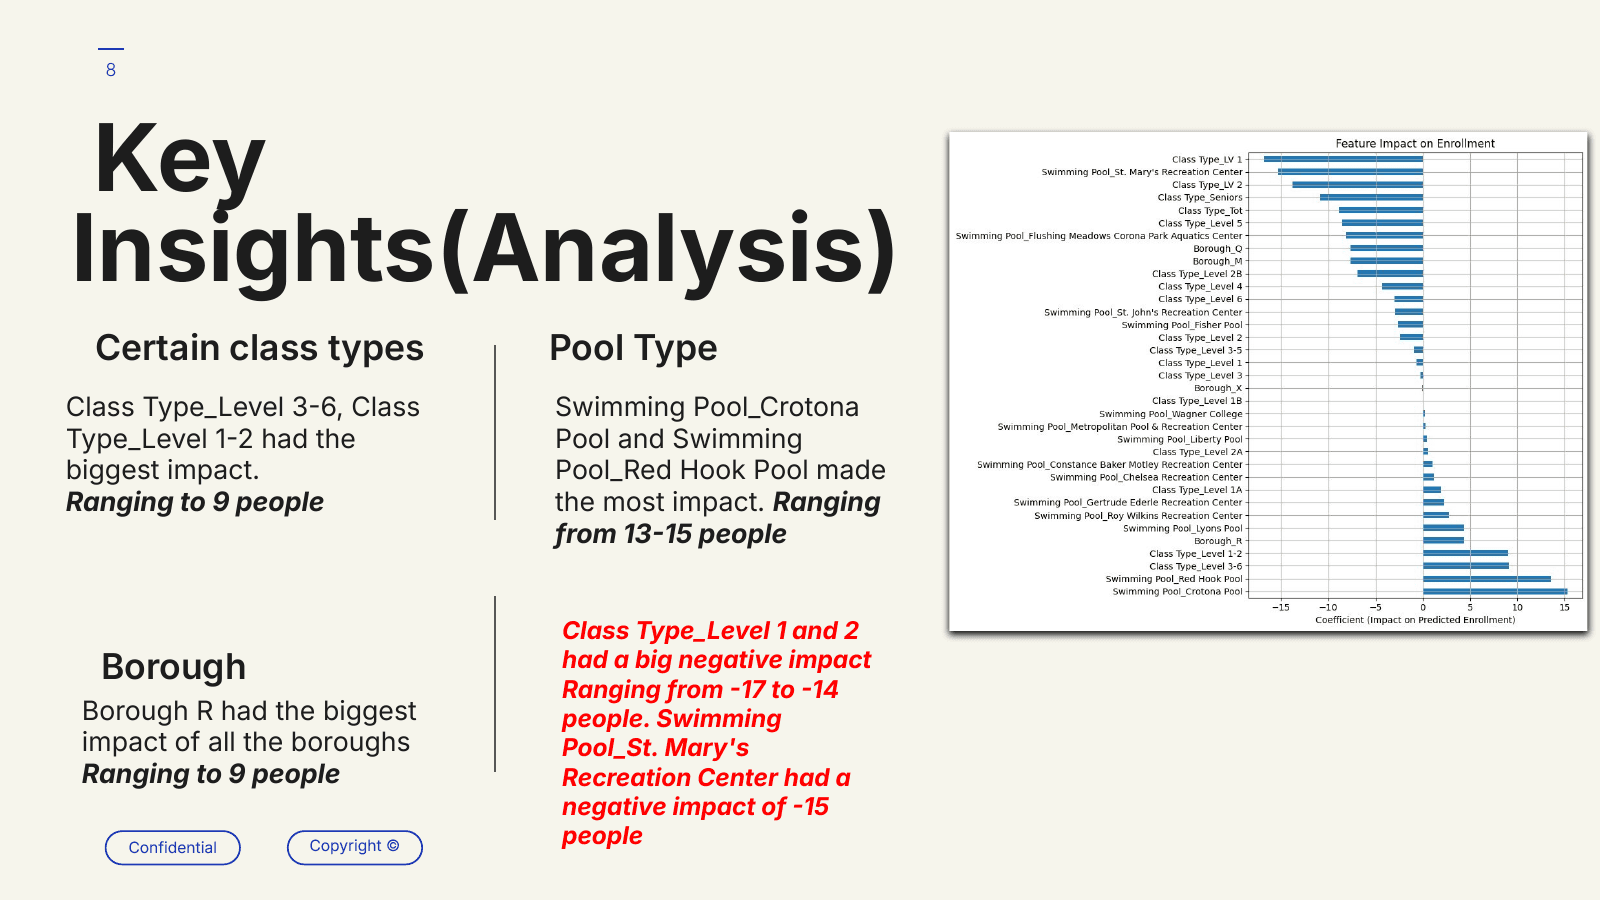
Feature impact analysis showing which class types, pools, and boroughs influenced predicted enrollment.
Deep dive
Optional technical detail if you want to go deeper.