CommercePulse
An end-to-end analytics pipeline that turns raw e-commerce data into modeled tables, business analysis, and Tableau dashboards.
Quick read
The project in a few seconds.
CSV → Tableau
Full analytics workflow.
PostgreSQL
Raw and transformed reporting data.
dbt
Staging, intermediate, facts, and dimensions.
96,478 orders
Delivered-order reporting model.
How it works
The project from input to outcome.
CSV
Raw Olist data
Python
Profile + validate
PostgreSQL
Warehouse
dbt
Transform + model
Tableau
Business reporting
My contribution
The pieces I directly worked on.
Built a full analytics pipeline from raw CSV files to Tableau dashboards.
Loaded and validated raw Olist data in PostgreSQL.
Created dbt staging, intermediate, fact, and dimension models.
Built SQL analysis for revenue, delivery, customer behavior, products, and sellers.
Created four Tableau dashboards for business reporting.
Documented data-quality issues and business findings separately from the code.
Engineering proof
A few decisions that show what was happening under the surface.
Decision 01
Separated raw, staging, intermediate, and mart layers so cleaning and business logic stayed organized.
Decision 02
Grouped payment rows before joining them to orders because one order can contain multiple payment records.
Decision 03
Handled duplicate review records before using review data in the final order model.
Results
The proof that the build came together.
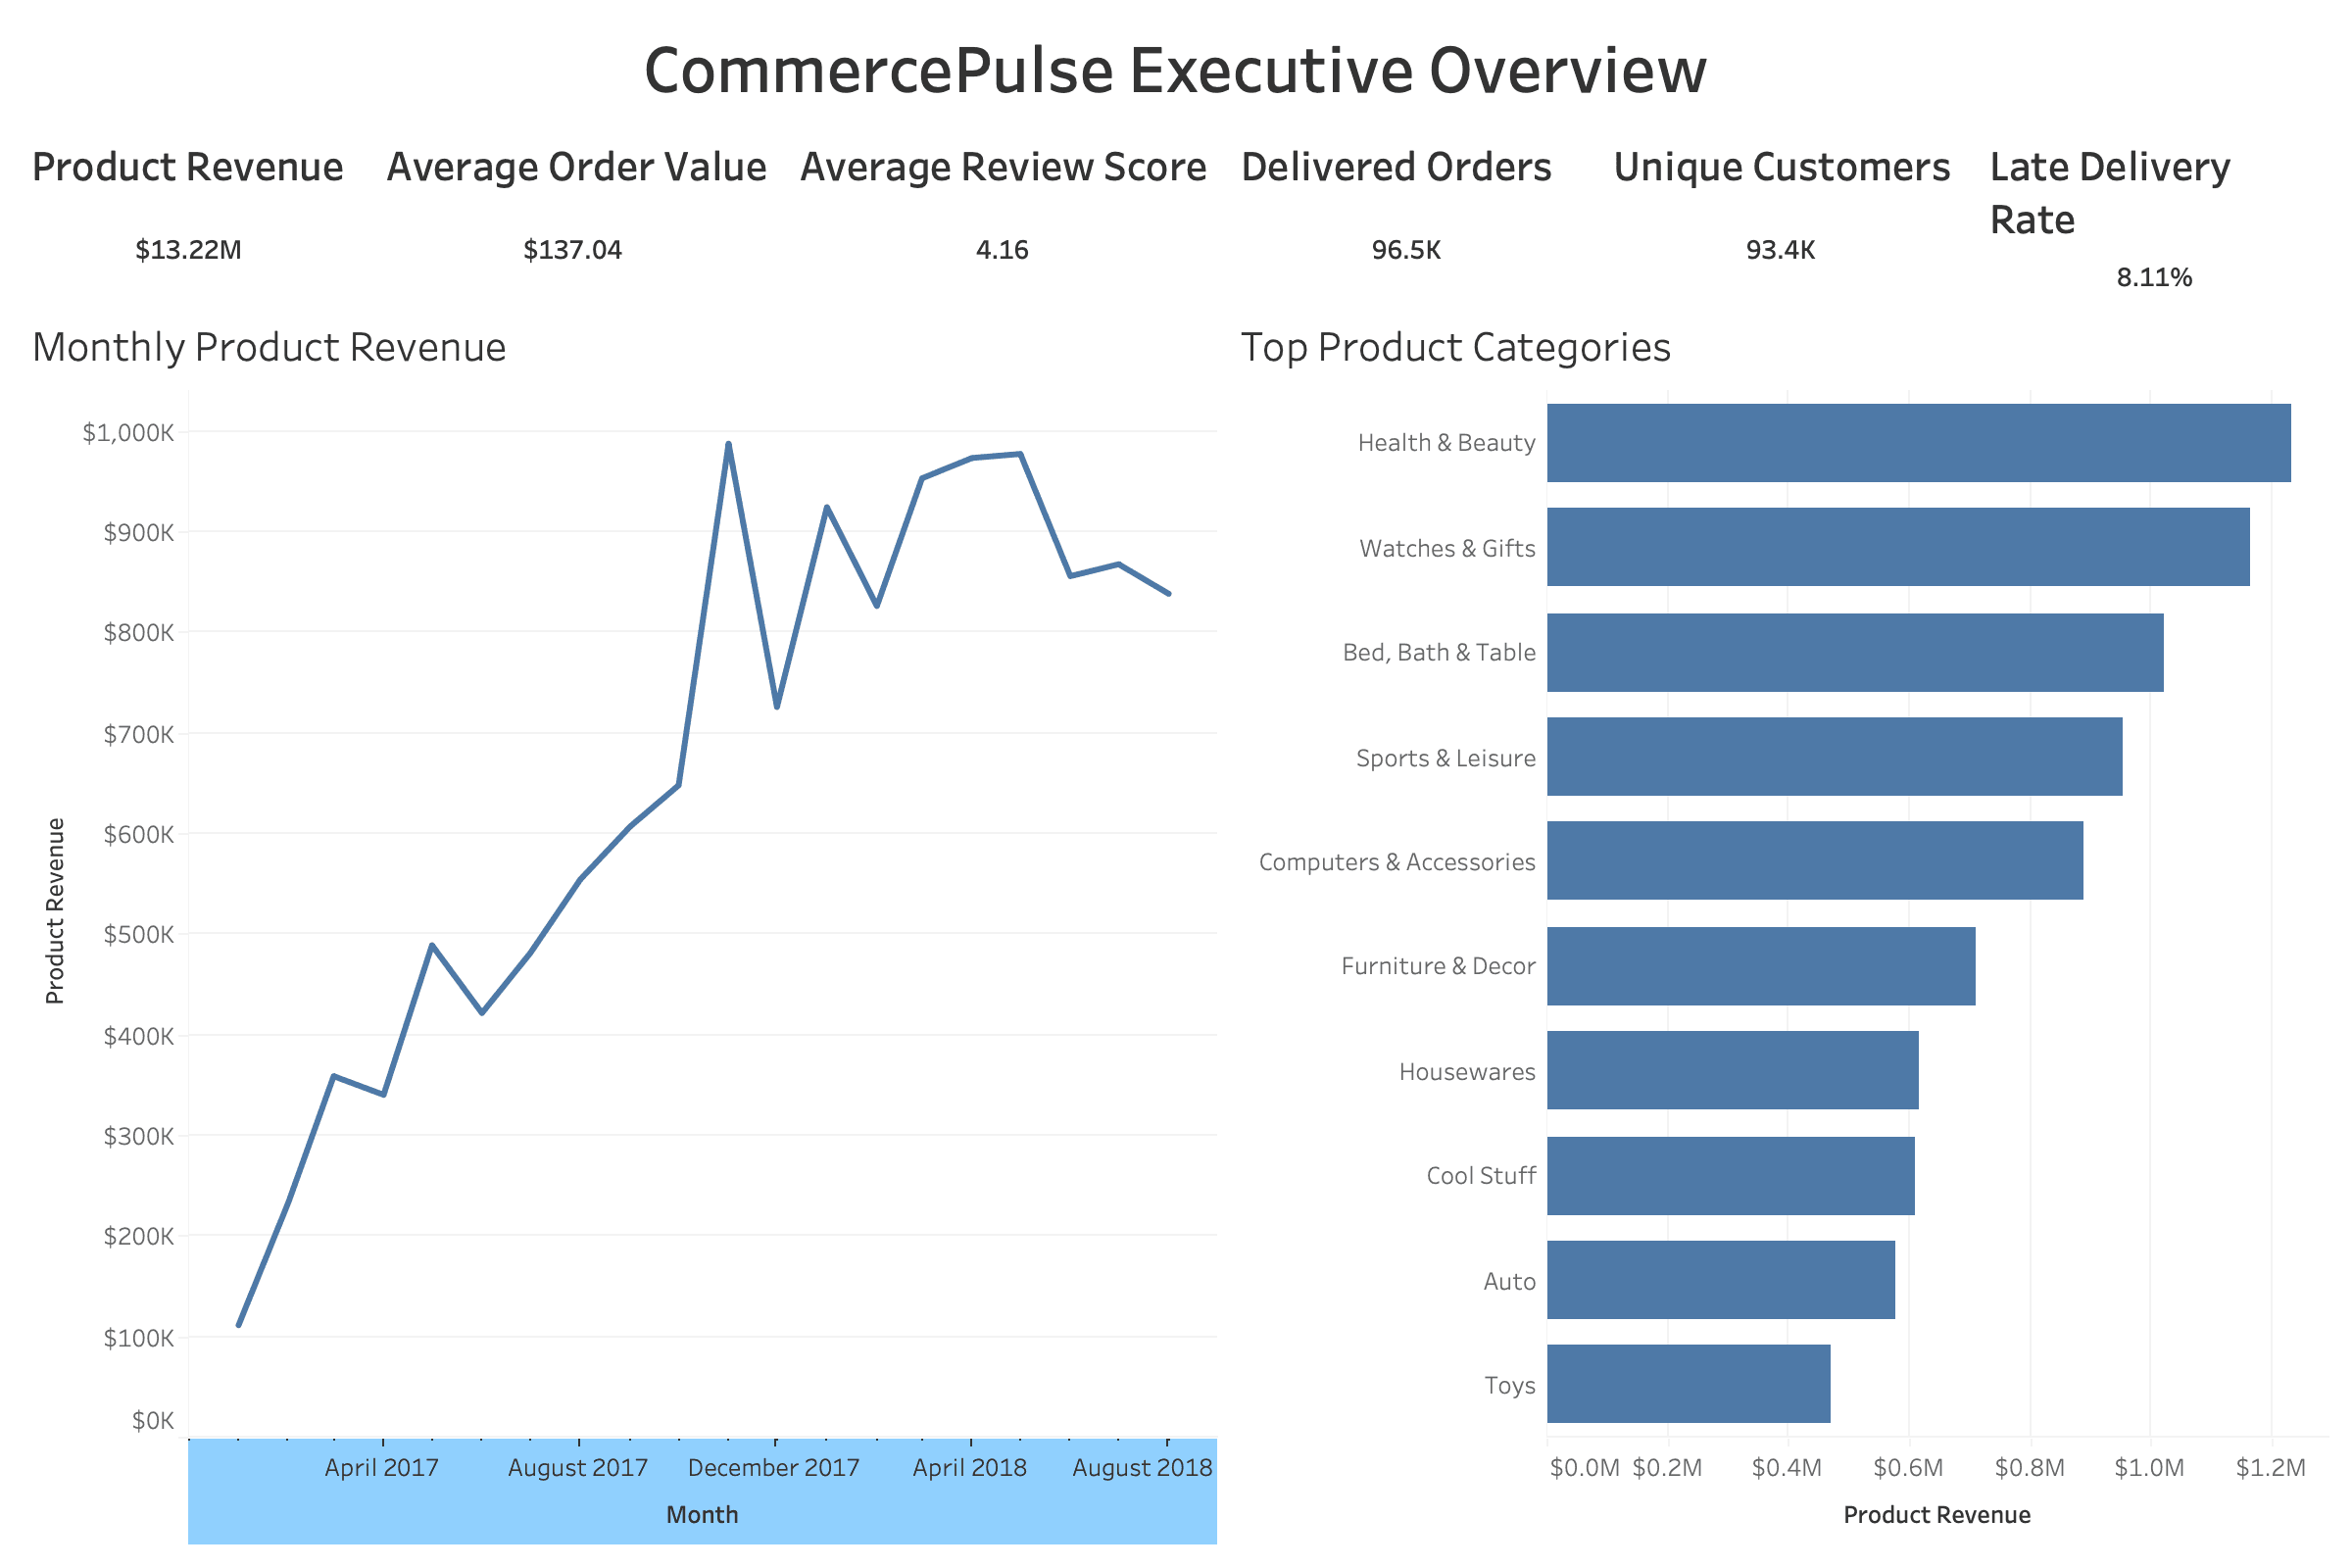
Built a reporting model covering 96,478 delivered orders and 93,358 unique customers.
Measured approximately $13.22M in product revenue with a $137.04 average order value.
Found that delivered orders had an average review score of 4.16.
Measured an 8.11% late delivery rate.
Product
See the work instead of only reading about it.
Executive dashboard showing revenue, delivered orders, average order value, review score, and delivery performance.
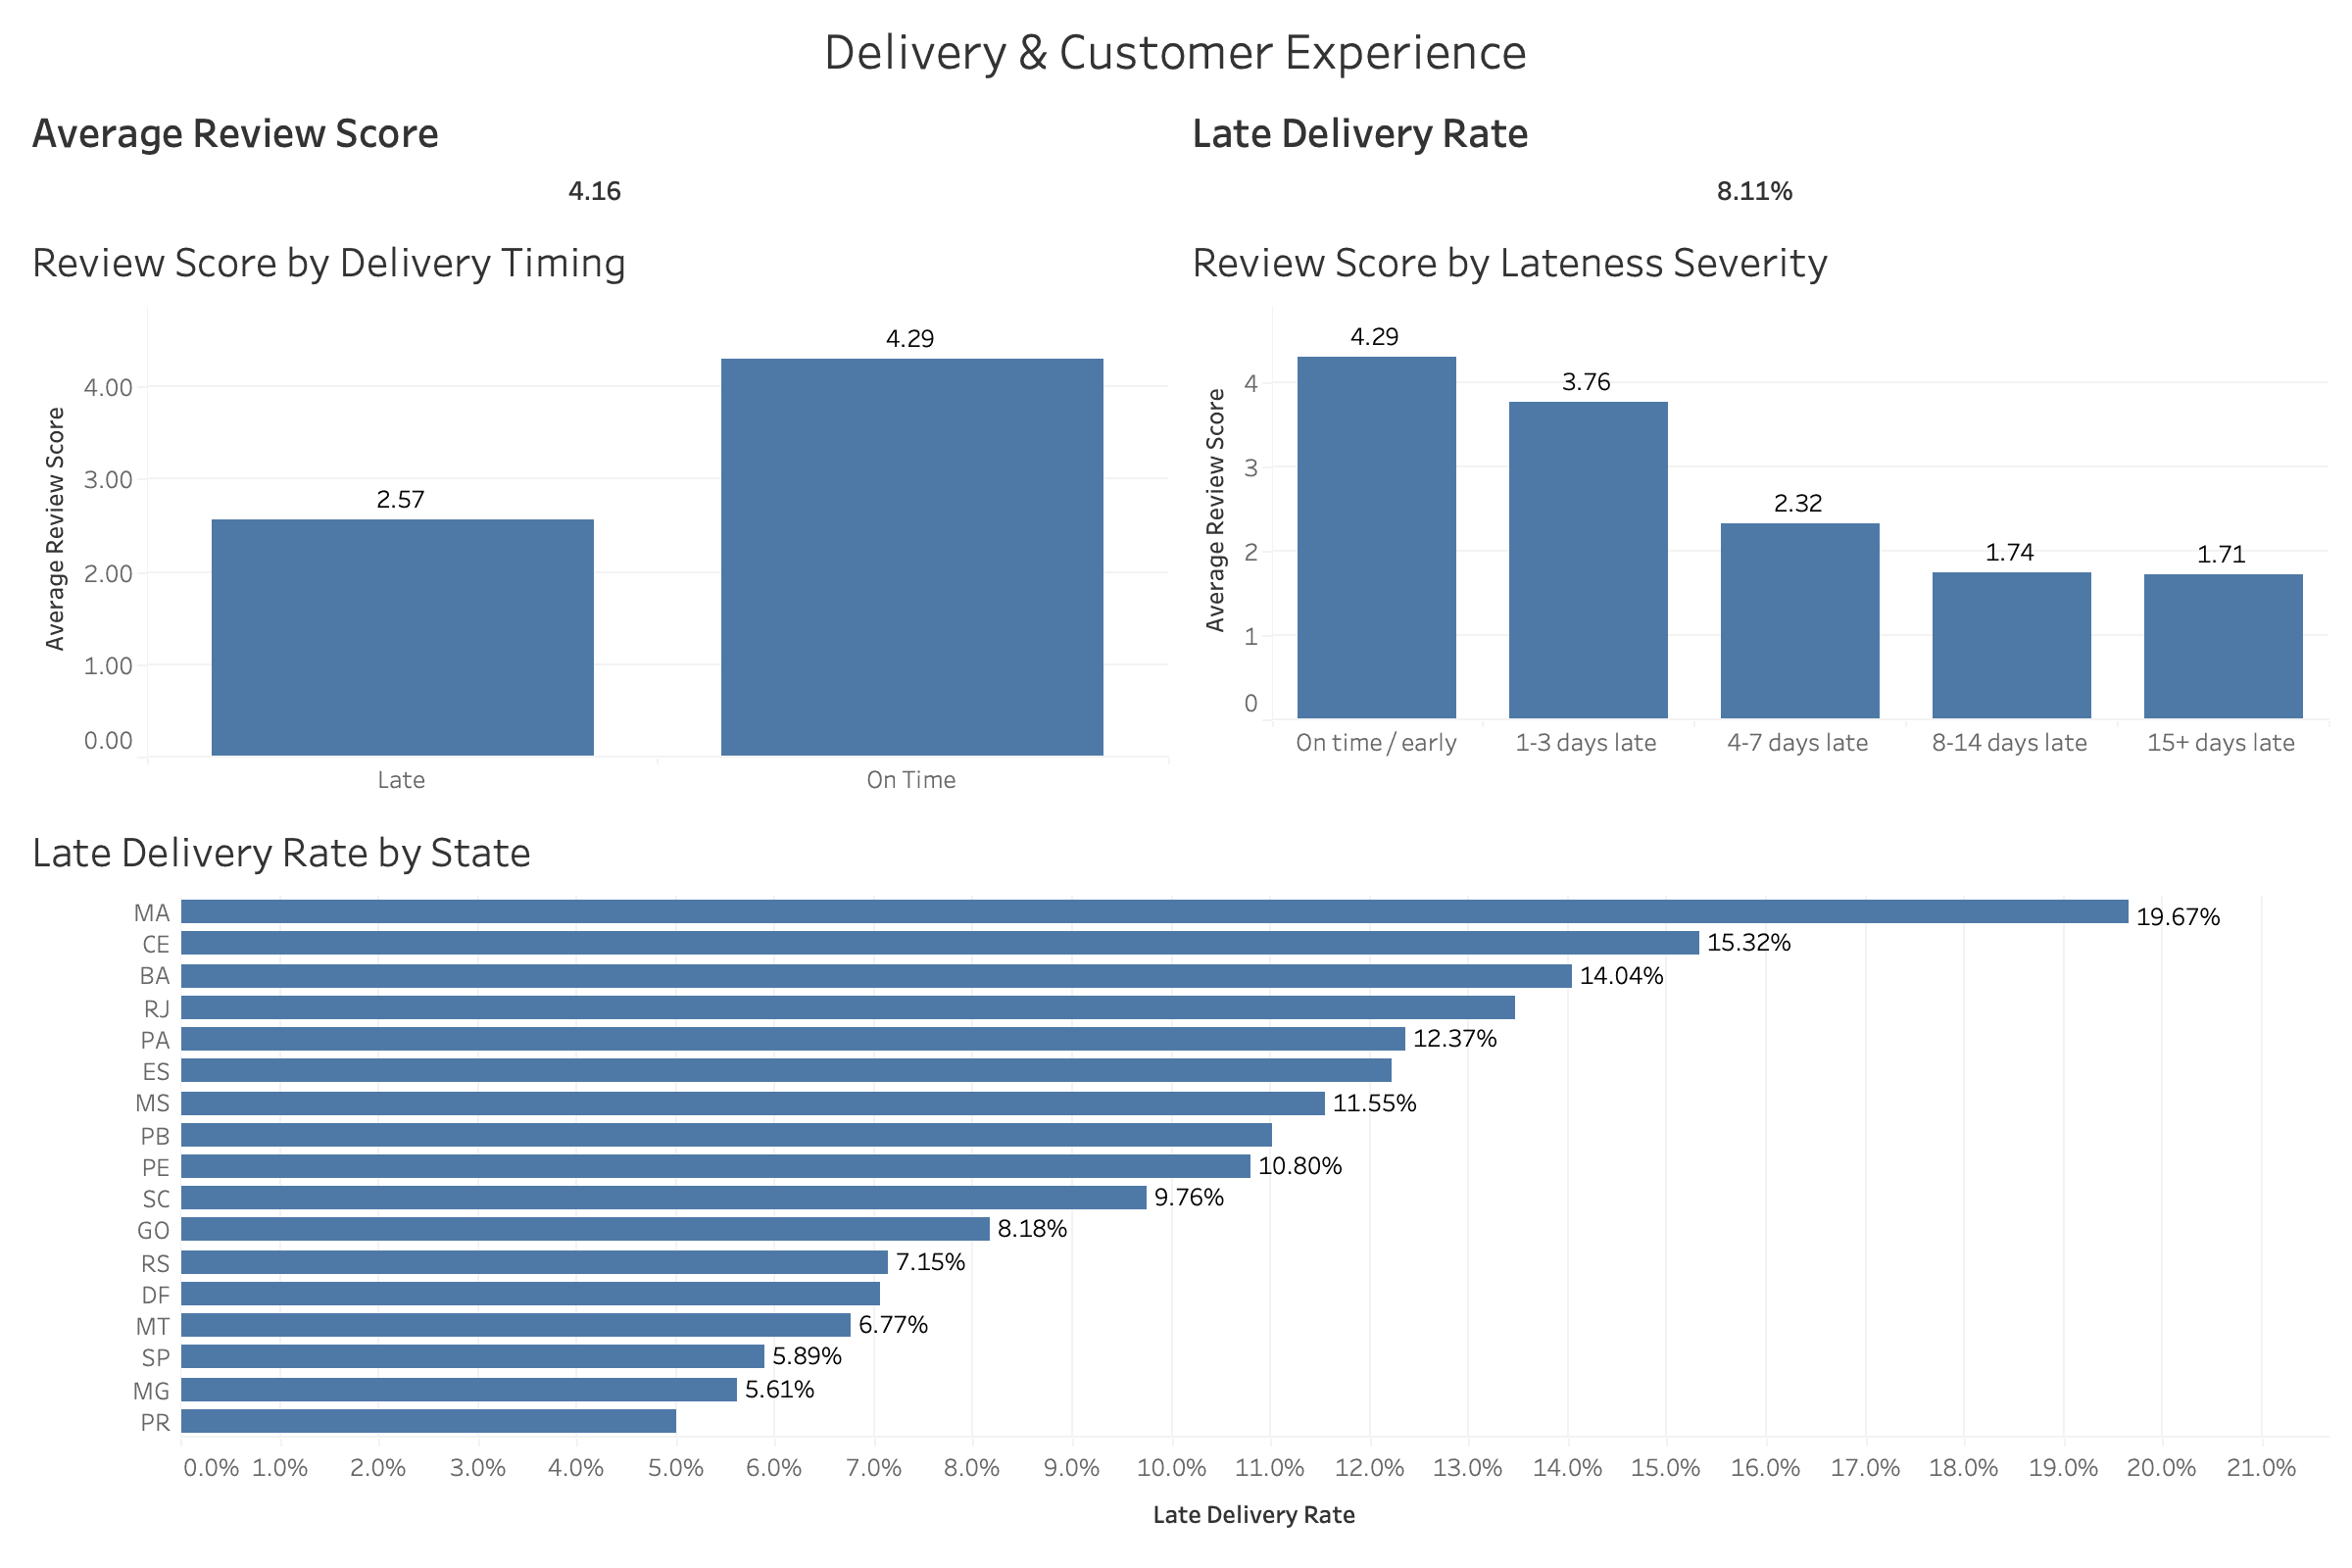
Dashboard showing delivery timing and its relationship with customer review scores.
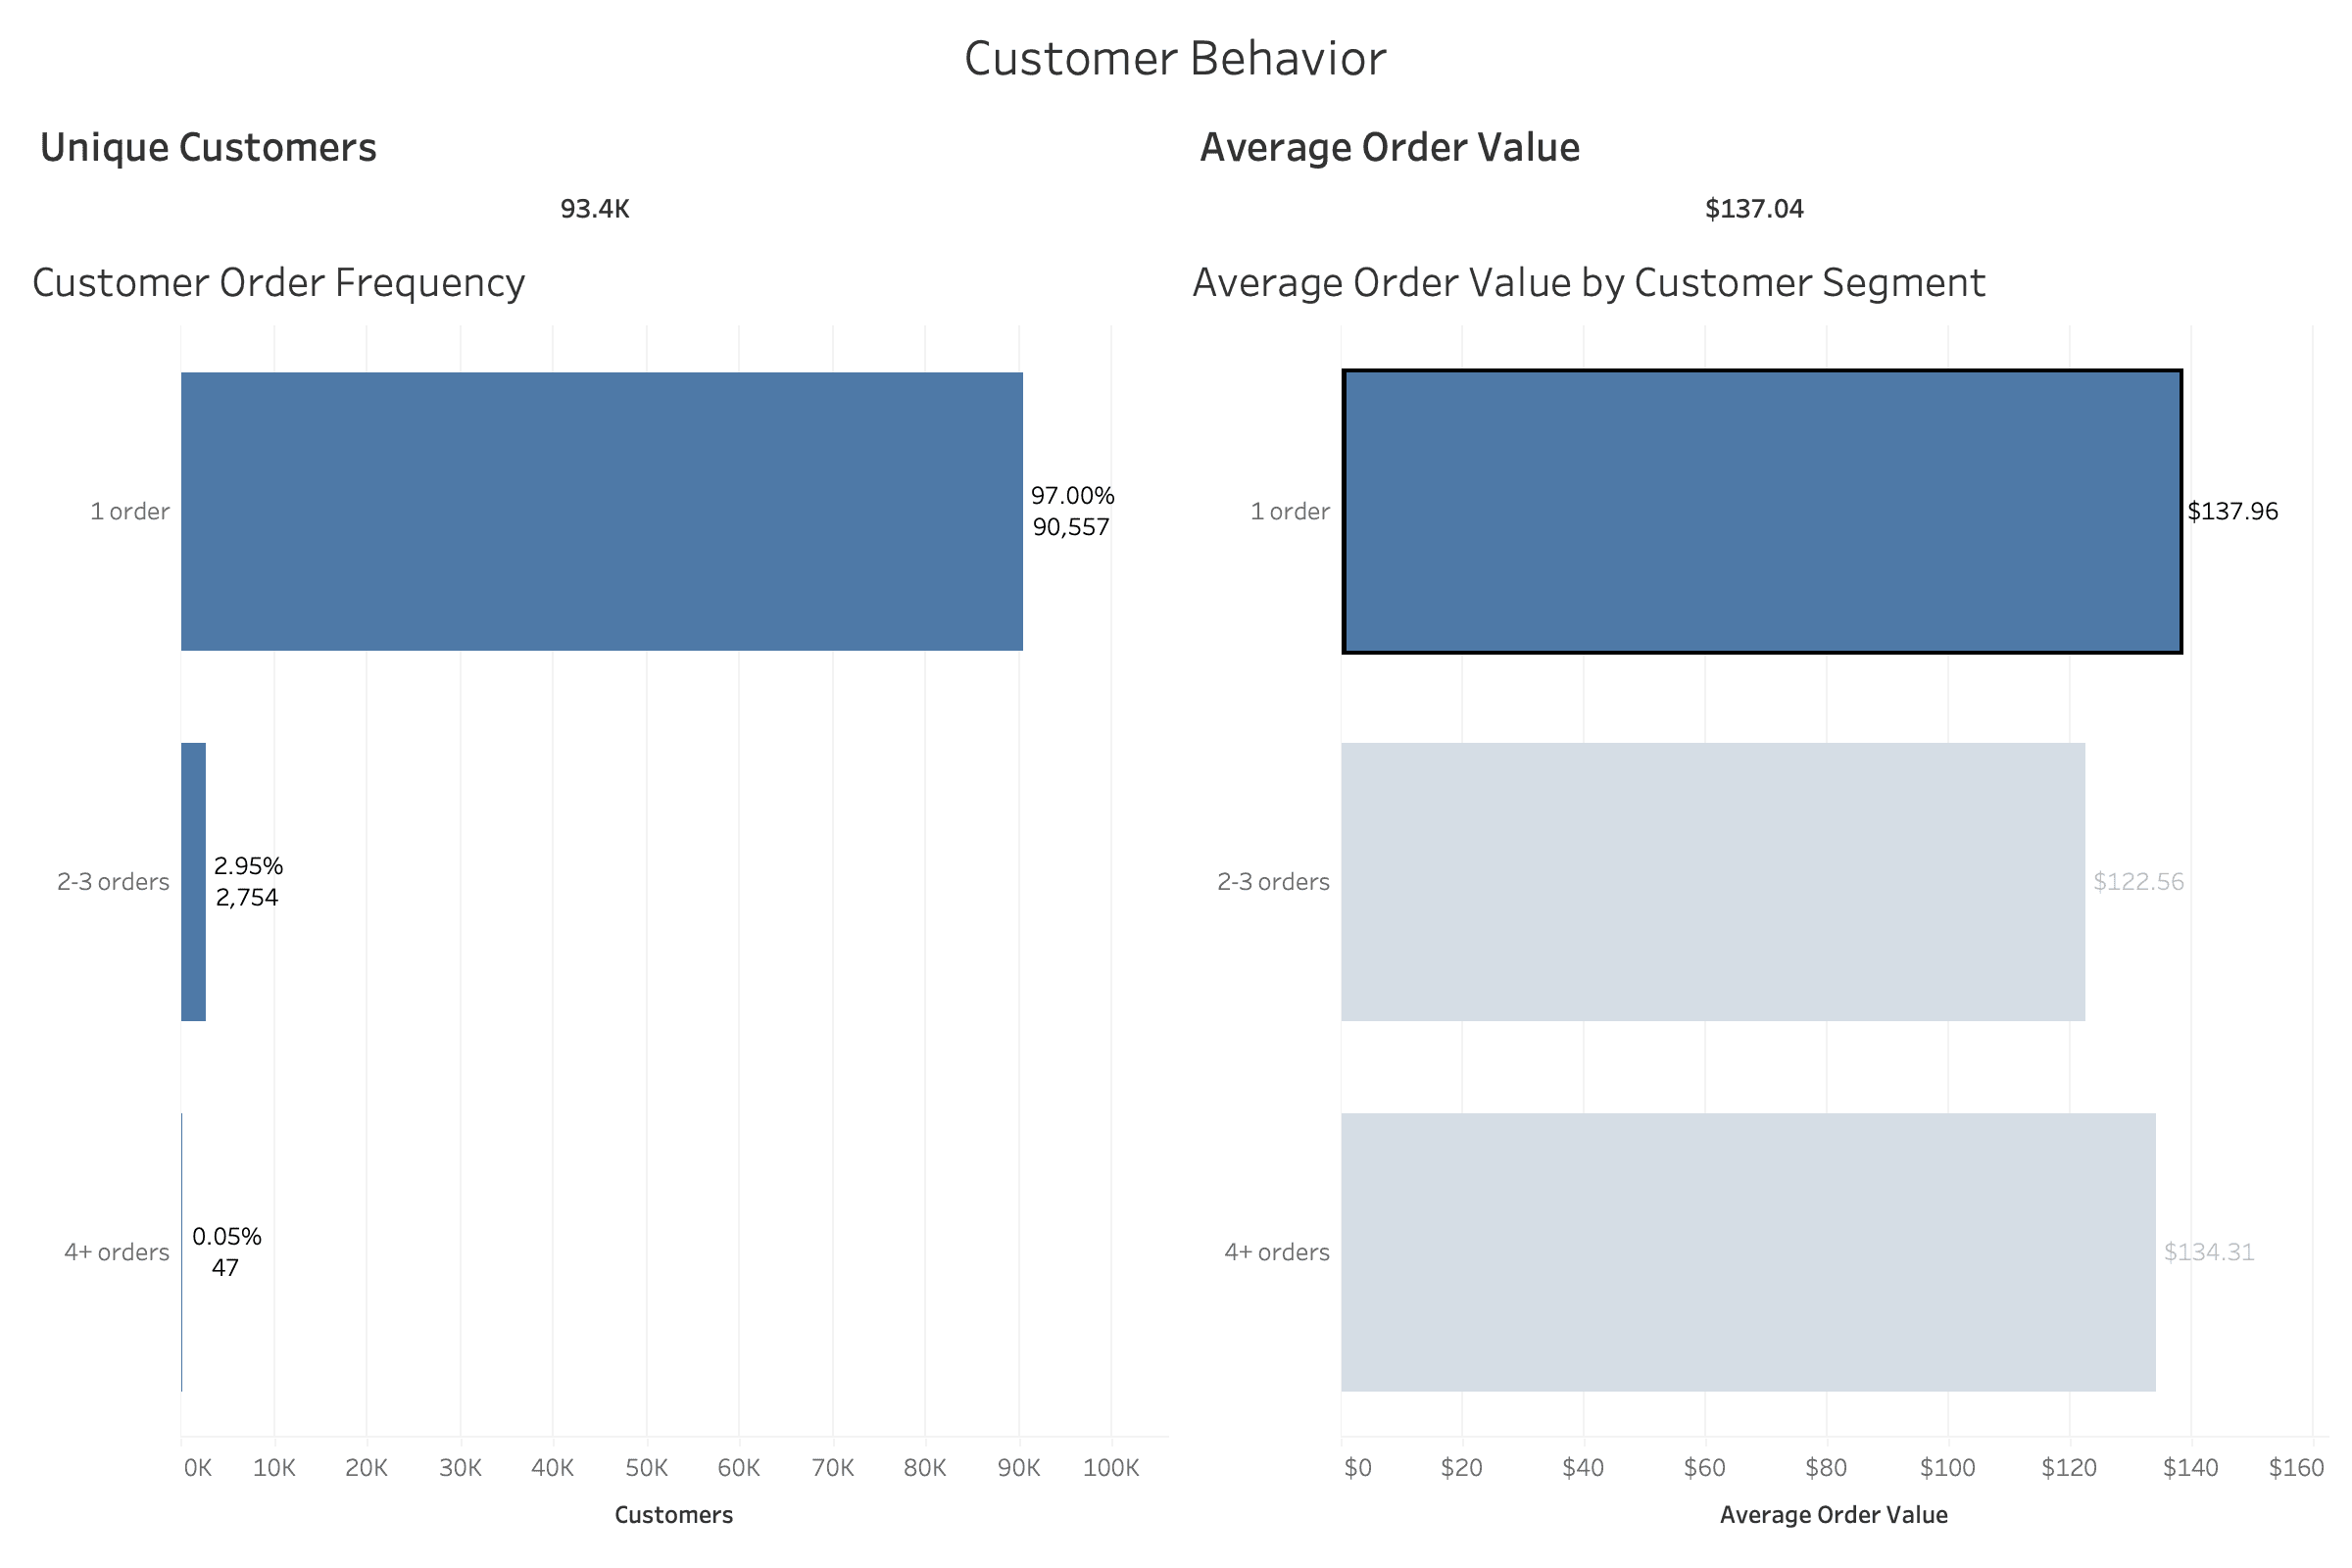
Customer dashboard showing repeat purchasing and order behavior.
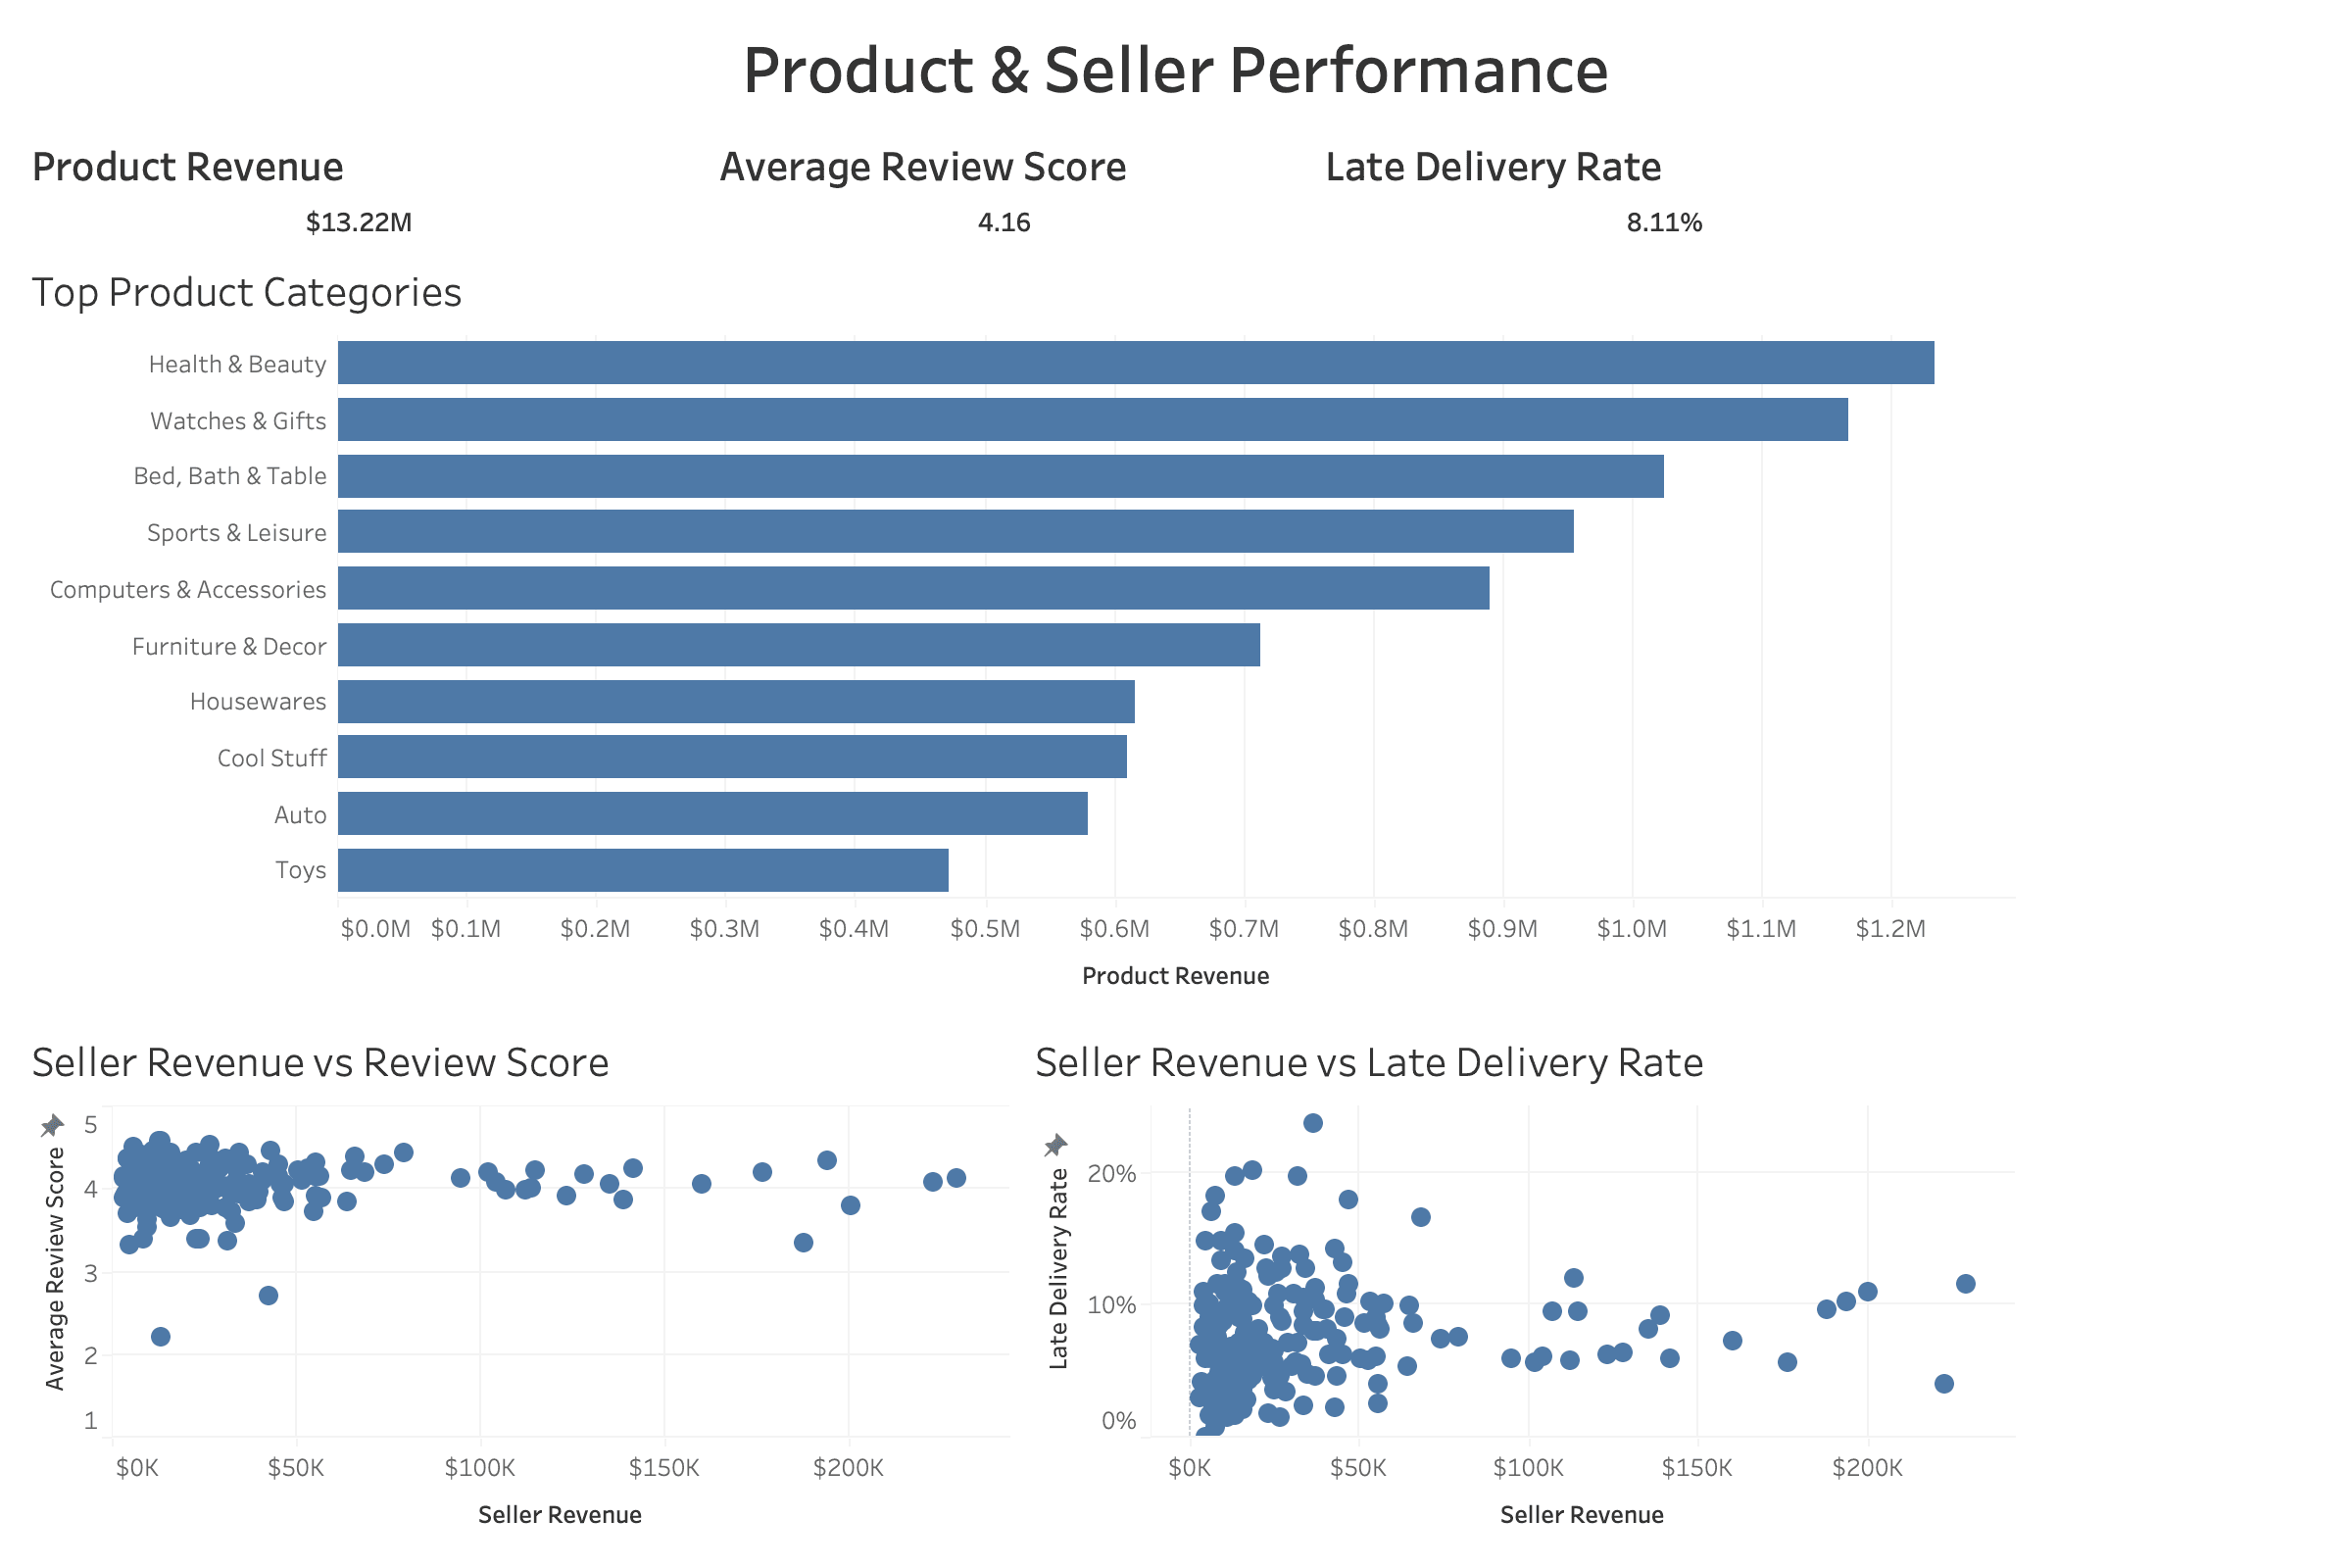
Dashboard comparing product categories and seller performance across revenue, reviews, and delivery.
Deep dive
Optional technical detail if you want to go deeper.